You can interactively explore live simulation results using sliders and model diagram linking.
Sliders
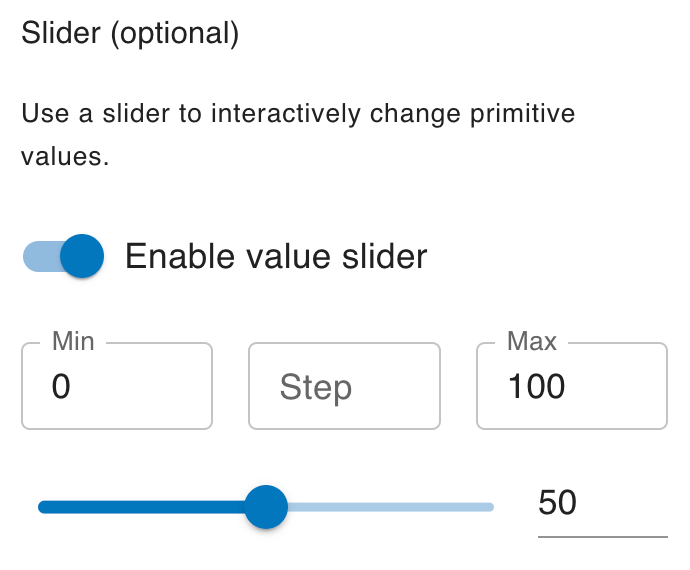
The values of your model's primitives can be controlled by sliders. To add a slider to a primitive, click on a primitive and then select "Enable value slider" in the sidebar. You'll be able to configure some optional things like the maximum and minimum allowed values for the slider.
Now, when you have nothing selected in the model, you will be able to view the sliders in the side bar. You can use the sliders to quickly configure the settings for your model. Here is an example of sliders for a climate model:
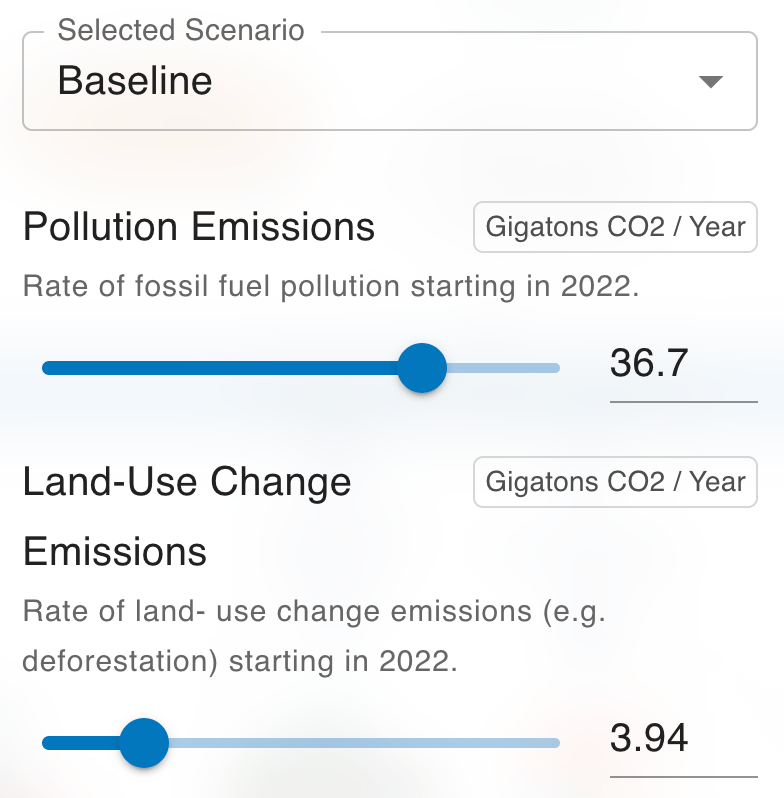
You can also save groups of slider values as "Scenarios". Scenarios allow you to quickly load common configurations for your model.
The product adoption model below has a slider on each of its two rates and three saved scenarios. Advertising Effectiveness is the share of the remaining potential adopters that advertising reaches each year, and Word of Mouth Strength is how strongly existing adopters pull in the rest. The two produce quite different curves, so loading a scenario or moving a slider reshapes the adoption path:
{
"engine": "SIMULATION_PACKAGE",
"name": "Product Adoption",
"simulation": {
"algorithm": "RK1",
"time_start": 0,
"time_length": 20,
"time_step": 0.25,
"time_units": "YEARS"
},
"elements": [
{
"type": "STOCK",
"name": "Potential Adopters",
"behavior": {
"initial_value": "100000",
"non_negative": true
}
},
{
"type": "STOCK",
"name": "Adopters",
"behavior": {
"initial_value": "100",
"non_negative": true
}
},
{
"type": "VARIABLE",
"name": "Advertising Effectiveness",
"behavior": {
"value": "0.01"
},
"display": {
"interactive": true,
"interactive_min": 0,
"interactive_max": 0.05
}
},
{
"type": "VARIABLE",
"name": "Word of Mouth Strength",
"behavior": {
"value": "0.4"
},
"display": {
"interactive": true,
"interactive_min": 0,
"interactive_max": 1
}
},
{
"type": "FLOW",
"name": "Adoption",
"from": "Potential Adopters",
"to": "Adopters",
"behavior": {
"value": "[Potential Adopters] * ([Advertising Effectiveness] + [Word of Mouth Strength] * [Adopters] / ([Adopters] + [Potential Adopters]))",
"non_negative": true
}
},
{
"type": "LINK",
"from": "Advertising Effectiveness",
"to": "Adoption"
},
{
"type": "LINK",
"from": "Word of Mouth Strength",
"to": "Adoption"
}
],
"visualizations": [
{
"name": "Adopters",
"type": "TIME_SERIES",
"elements": [
"Adopters"
]
},
{
"name": "Adoption",
"type": "TIME_SERIES",
"elements": [
"Adoption"
]
}
],
"scenarios": [
{
"name": "Baseline",
"values": {
"Advertising Effectiveness": 0.01,
"Word of Mouth Strength": 0.4
}
},
{
"name": "Advertising Push",
"values": {
"Advertising Effectiveness": 0.05,
"Word of Mouth Strength": 0.4
}
},
{
"name": "Word of Mouth Only",
"values": {
"Advertising Effectiveness": 0,
"Word of Mouth Strength": 0.9
}
}
]
}
Model Diagram Linking
After you have done a simulation, you can hover over the primitives in your model to show a chart in a tooltip, displaying the value of that primitive over the course of the simulation. If you have multiple results windows, the chart tooltip will show you a comparison of the different runs.
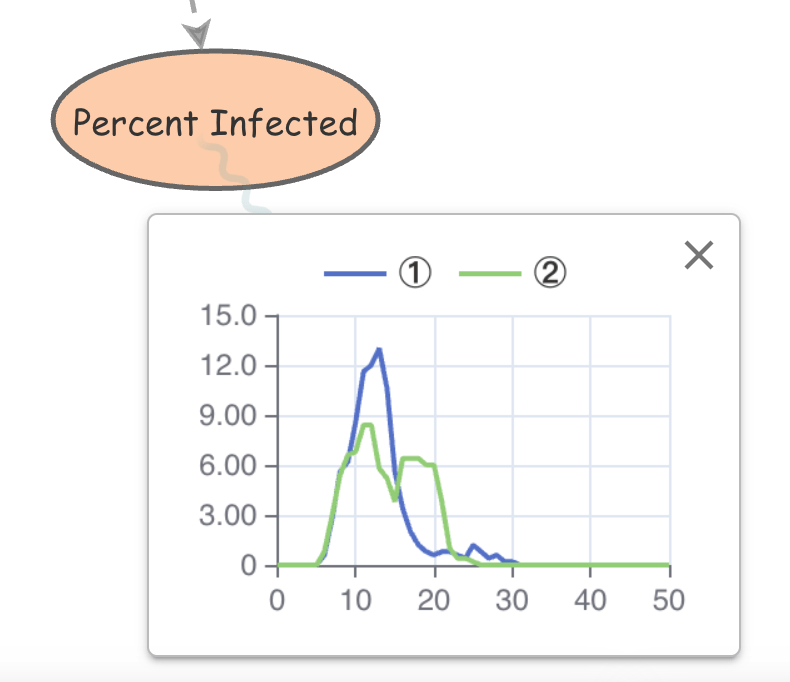
You can drag these tooltips to reposition them and make them persistent.
